Single particle cryo-EM as a tool in structural biology
In cryogenic transmission electron microscopy (cryo-EM), a two- dimensional (2D) projection is generated from a thin vitrified specimen through which an electron beam is sent. In order to reconstruct the three-dimensional (3D) volume, multiple viewing angles of the same object must be covered. To this end, the specimen can either be imaged from different angles by tilting it, as done in cryo-EM tomography, or a specimen that is imaged at a fixed angle of 0° must contain multiple copies of the object in different orientations. The latter approach is used in single particle cryo-EM, which will be discussed in the following paragraphs.
Construction of the transmission electron microscope
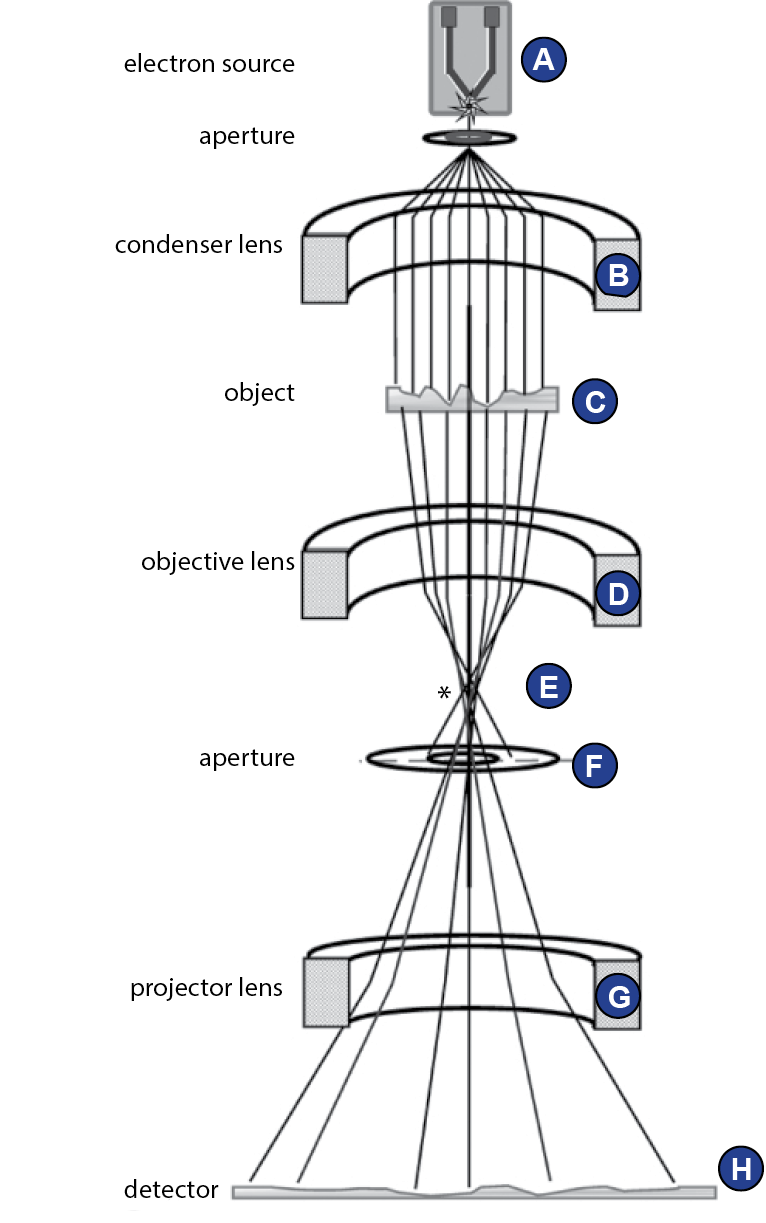
The interior of a transmission electron microscope (TEM) is evacuated. Electrons are emitted from the cathode, or electron gun (Figure 17A). Because electrons interact with an electromagnetic field, they can be focused using magnetic lenses. The condenser lens (Figure 17B) transforms the emitted electrons to a parallel beam. The following acceleration of the electrons in the column is directly coupled to a theoretical point resolution limit, as will be explained below. Nowadays, usually 120-300 kV microscopes are used for single particle cryo-EM. The object (Figure 17C) is inserted into the column via a vacuum lock. The incident wave is modified by the object such that it carries the information about the object’s structure. The ojective lens system (Figure 17D) focuses the scattered wave to form the real image. The focused beam forms the Fourier transform/diffraction pattern of the wave in the back focal plane (Figure 17E). A phase plate can be inserted here to shift the phases (Orlova and Saibil, 2011). As high frequency information is scattered at high angles, at this point the size of the objective aperture plays an important role (Figure 17F). The projector lens system contains several magnification lenses (Figure 17G). To exclude electrons of certain energies (e.g. those that lost energy and changed wavelength due to interactions with the sample), which would otherwise reduces image quality, an energy filter can be used. Finally, the electron wave reaches the detector (Figure 17H).
Cryogenic transmission electron microscopy allows imaging of biological specimens
The distinctive feature of cryo-EM versus other structural methods is that it allows imaging of biological samples at near-native conditions. The specimen is plunge frozen in liquid ethane, a process that happens so fast that the hydration state of the molecule and its native conformation are unaffected (Dubochet et al., 1988). The molecules are now embedded in a thin layer of amorphous ice and can be imaged in the microscope. Additionally to the basic elements of a TEM described above, the cryo-TEM must ensure that the specimen is steadily kept at a temperature of below -180° C. Therefore, the specimen is inserted into the column via a special cryo-holder where it is kept in liquid nitrogen. The microscope is cooled with liquid nitrogen or sometimes helium.
Interaction of the electrons with the sample
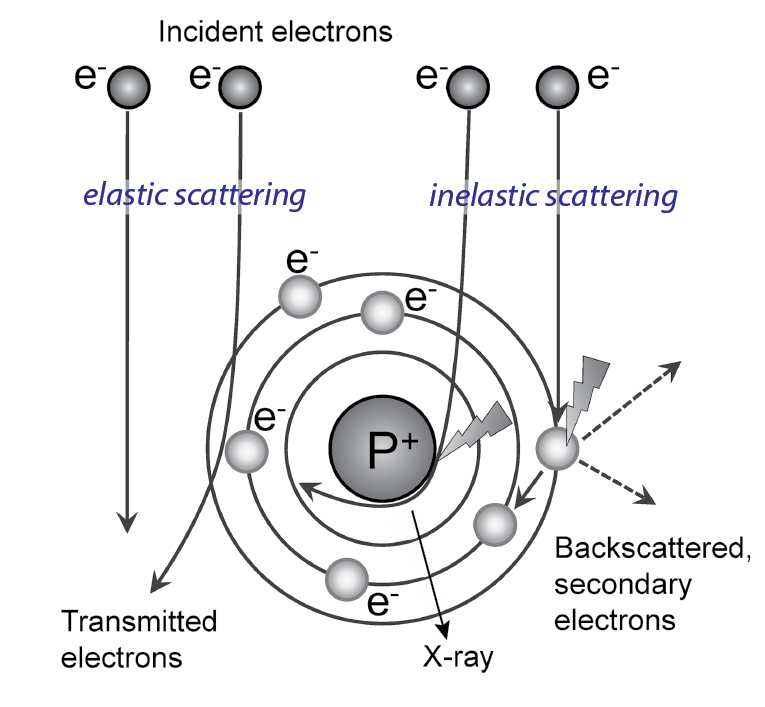
Electrons can interact with the specimen or pass through it without interaction. If the electron passes without interaction, no information about the specimen is gained, and it contributes to background. The changes that occur to the electron by interacting with the sample make it carry information about the sample. In case of interaction, two types are distinguished: elastic and inelastic scattering.
When scattered elastically, the electron is deflected by the Coulomb potential of the specimen atoms without loss of energy. The deflection is expressed in a change of phase of the electron wave (Figure 18). Elastic scattering is the main interaction of electrons with biological specimens, which consist of light atoms (H, C, N, O, P, S). Elastic scattering contributes to phase contrast.
In inelastic scattering, the passing electron transfers energy to the specimen and both energy and phase of the electron change (Figure 18).
The lower the kinetic energy of the electron (e.g., at low voltage), the higher is the probability of inelastic and elastic scattering events. The general probability of electron-sample interaction and thus signal-to-noise ratio can be enhanced by increasing the electron dose. However, transfer of energy from the electron to the sample is associated with sample damage (Egerton et al., 2004). Low dose conditions with mean exposure of 20-30 electrons per Å2 are therefore usually applied for cryo EM of biological samples to limit the damage. To obtain a meaningful signal nevertheless, cryo-EM single particle analysis uses many low dose measurements of copies of the sample, which are then summed up (Cheng et al., 2015; Frank et al., 1992).
Cryo-EM of biological specimens is dominated by phase contrast
Image detectors record the electrons that hit a pixel. Because of the negligible amplitude loss in biological material and under the necessary low dose conditions, there will be almost no contrast visible for an image taken by an ideal cryo-TEM in focus.
There are two ways to solve this problem:
To use heavy atoms to increase amplitude contrast. For example, in negative staining, uranylacetate is used to stain the outside of the particles, such that one obtains a ‘negative’ (as example, see Figure 45). This is often done for screening of a sample and is justified for determining the overall shape of a particle, but will not yield high resolution.
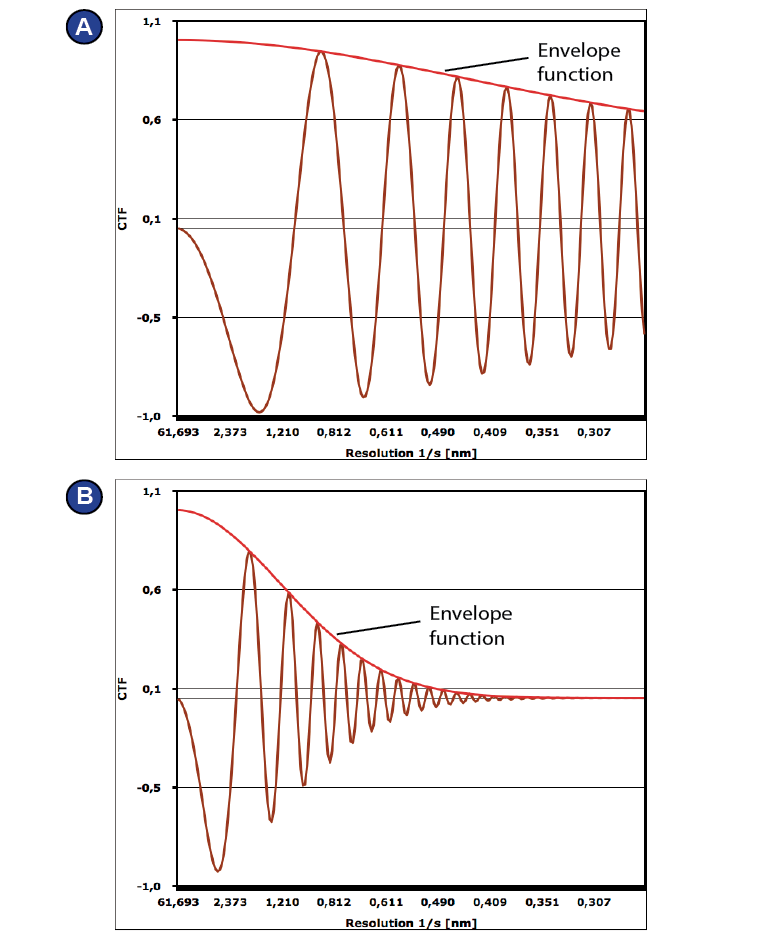
To optimize the (phase) contrast transfer function (CTF), which describes the relation between the original image and the one that is detected and contains microscope-specific information. It is the convolution of the sinus of the aberration function χ(f) (1) and an envelope function E(f) that represents the dampening of the signal (de Jong and Van Dyck, 1993) (2). The aberration function χ(f) depends on the spatial frequency f, the wavelength λ, the spherical aberration Cs, which is microscope-specific, and the defocus δ, which can be adjusted via the objective lens current (de Jong and Van Dyck, 1993) (1). The envelope function depends amongst others on the defocus and on the electron source.
Images are usually not taken in focus. Instead, a defocus (δ) is employed, which increases the phase shift of the scattered vs. the unscattered beam. The efficiency by which the CTF transfers information depends on the spatial frequency and is different for different defocus values (Figure 19). Some information is missing completely, namely at each zero crossing. To compensate for this selective loss of information, images are usually taken at different defocus values, e.g. in a range of -500 to -2500 nm. Later, the exact defocus is recalculated for each micrograph (sometimes, even for each particle) and used for correction of the images during processing.
Spherical aberration (Cs) means that the electron beam is not focused exactly by the objective lens; instead, different components meet the optic axis at different heights, contributing to phase contrast as well.
By adjusting the defocus, χ(f) can be optimized such that the transferred contrast is enhanced. The samples presented in this work were all imaged employing this approach of taking images in defocus for enhancing phase contrast.
Another way of enhancing phase contrast is borrowed from light microscopy and consists in the usage of a phase plate (the term ‘Volta phase plate’ is often used in cryo-EM, in light microscopy the term ‘λ/4-plate‘ is used). It delays part of the electron beam and thus enhances the phase shift such that it can be measured as intensity (Zernike, 1942). Phase plates are not essential for visualizing large molecular assemblies like the ribosome, but their optimization and introduction into the field of cryo-EM nowadays allows visualization of very small molecular complexes that can hardly be realized when employing defocus variation (Danev and Baumeister, 2017).
Direct electron detectors contributed a great deal to the ‘resolution revolution’
The establishment of direct electron detectors contributed a great deal to the improvement of resolution in cryo-EM. Single electrons can be detected by these cameras, which possess a very thin active layer from which individual diodes can read single pixels (Faruqi McMullan, 2010). The key is that the incoming electrons are recorded as change in the potential of the diodes and not first converted to light by scintillators as in old CMOS detectors. The point spread function (PSF) is therefore much smaller and the position of the incoming signal is recorded with a higher accuracy and a higher signal-to-noise ratio.
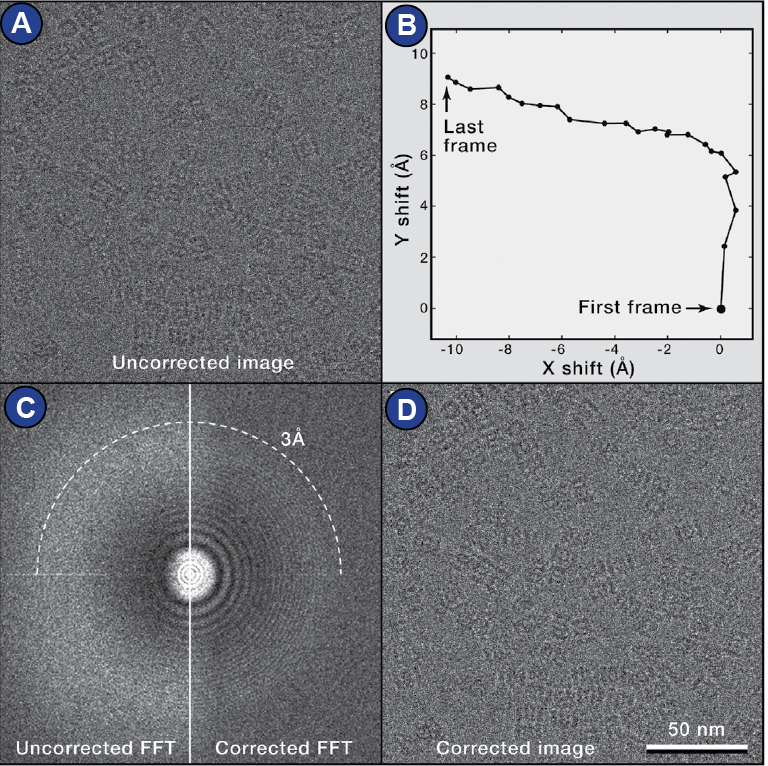
The current state of the art is that images are collected as multiple frames (movie mode). Thus, beam-induced motion of the sample can be compensated by realigning the movie frames, a process that is called motion correction (Cheng et al., 2015; Zheng et al., 2017) (Figure 20).
Speed is also an important factor: The K2 Summit camera (Gatan), for example, has a sampling rate of ~400 images per second, enabling the detection of single events (incoming electrons). Such event is recorded over the whole detector area, of which each pixel detects a different intensity. Additionally to an intensity maximum in a certain pixel, the surrounding (weaker) intensities are measured by the neighboring pixels and thus the position relative to the maximum inside the pixel itself (quadrant-wise) can be recovered. Superresolution mode takes advantage of this and leads to a theoretically halved pixel size (Figure 21).
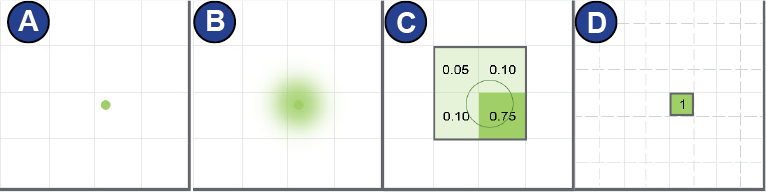
Image processing leads from 2D projections to 3D volumes
The particle images that are recorded present 2D projections formed by sending a set of parallel beams through the specimen. The intensity recorded by each pixel can be interpreted as the sum or integral of the object’s intensities along the beam.
The information that a 2D projection image contains can be described by the sum of different wave functions. Low frequency information contributes to the overall shape of structures in the image, like the rough outline of a ribosomal particle, whereas high frequency information contributes tofine details, like the position of single residues.
The Radon transform (Radon, 1986 -originally published in 1917) describes the function that calculates the integrals of a 2D image at given angles and thus disassembles the 2D image in its projections. Importantly, if all angles are completely covered, an object can be completely reconstituted from its projections using the inverse Radon transform. The inverse Radon transform is the approach that in principle is used to obtain 3D reconstructions of the molecules imaged by cryo-TEM, only that the set of projections from a cryo- EM experiment is not 100% complete. Moreover, the data contains noise that might interfere with high-frequency information.
To carry out inverse Radon transform from experimental data, several methods can be used: 1) Filtered backprojection, where the 2D image is smeared along the projection axis in real space, 2) Fourier interpolation, where the Fourier transforms of the projection are interpolated in Fourier space, forming the Fourier transform of the reconstructed image, which is then inverse Fourier transformed. A high-pass filter (e.g., ramp filter) can be applied to the Fourier transforms to unblur the resulting image. 3) Algebraic reconstruction technique (ART), where the reconstruction problem is formulated as a large set of equations that are then iteratively solved (Kaczmarz, 1937).
However, for these methods, of which nowadays Fourier interpolation is most commonly used for cryo-EM reconstructions, the angles from which the projections were generated must be known. Therefore, a key procedure in single particle cryo-EM is the finding and optimization of the orientation parameters (see below).
Notably, a single projection image has a very low signal to noise ratio. Therefore, similar projections can be grouped to one image stack. Subsequent class averaging improves the signal-to-noise ratio. 2D classification of particle images is a good start when handling data of which the 3D structure is unknown. From these 2D classes or a selection, an ab initio reconstruction can be calculated by back- projecting the 2D images to guess a 3D volume, which over several rounds of comparison with the backprojections is improved.
In case that one has already an idea of the structure, this step can be skipped and one can proceed with refinement and sorting.
Refinement is the optimization of the orientation parameters. In the approach of projection matching, cross-correlation or maximum likelihood methods are used to compare the original projection images with computed projection images of the reconstructed volume/the reference.
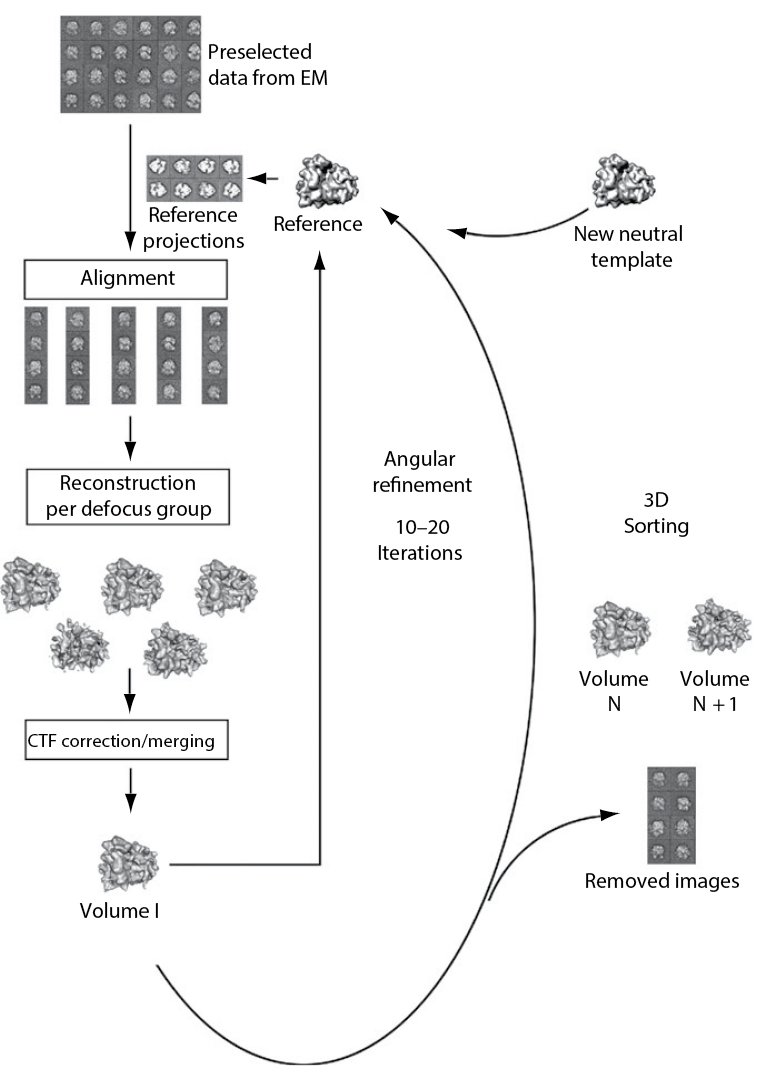
Sorting means that one splits the dataset into subpopulations in case of heterogeneity of the sample. The ribosome is a good example for an object that gives quite heterogeneous datasets because of its intrinsic dynamic described above (subunit rotation, head swivel, etc.). Large differences can be sorted by adding a neutral reference, for example an empty, strongly filtered volume (Figure 22). Smaller, more local differences can be unveiled by masking the region of interest and comparing reference projections obtained through this mask (focused reassignment) (Penczek et al., 2006).
Pitfalls to avoid when calculating a structure are reference bias and overrefinement. Reference bias means that noise can align to features of any given reference volume and reproduce it (example: Mao et al., 2013). Therefore, the reference must be chosen with care, optimally it is a volume coming from the dataset itself by ab initio reconstruction, and it must be low pass filtered. Filtering is also important for avoiding overrefinement, that means that noise in the images aligns to fine structure of the reference projections and thus distorts the overall result.
The final maps and resolution limits of cryo-EM
Both the hardware (the microscopes and the image detectors) and the software that is used to reconstruct the 3D volume from 2D projections have been optimized in the past years and the slogan ‘resolution revolution’ has become very popular to describe the improving quality of single particle cryo-EM structures (Kuhlbrandt, 2014).
In analogy to light microscopy, the theoretical resolution limit of a transmission electron microscope is directly coupled to the wave length. In a 300 kV microscope, the electron gains a kinetic energy of 300 keV, and its wavelength is 1.969 pm according to formula (3) (Relativistic formula for the calculation of velocity, where λ is the wavelength, h is the Planck constant, E is the energy, m0 is the rest mass of the electron, E0 is the rest energy of the electron (Reimer and Kohl, 2008)). One possible way of estimating the resolution limit of a (light) microscope is to use Abbe’s equation (4) (Lipson et al., 1995). For a microscope with a numerical aperture NA=0.01 and light at the wavelength λ=1.969 pm, the theoretical point resolution limit would be ~0.99 Å: atomic resolution.
This example of Abbe’s equation illustrates the potential of an EM compared to a light microscope due to the difference in wavelength. However, for estimating the resolution of a final map, the point resolution of the microscope does not play any role. Instead, statistical measures are used.
The final map’s resolution is based on self-consistency of two raw (unfiltered) half maps: In Fourier space, the Fourier transforms of the half maps are compared pixel by pixel using cross correlation along the radius (representing the spatial frequency) of the Fourier shells. As result, correlation values (FSC) are found for each spatial frequency. The spatial frequency that falls below the threshold of 0.143 FSC is defined as the last spatial frequency with a sufficient correlation value, and thus all information that is in a higher frequency range is considered unreliable because it contains more noise than signal (Rosenthal and Henderson, 2003). The reciprocal spatial frequency corresponds to the resolution (Examples in the results section, Figure 28, Figure 40, Figure 50, Figure 51).
In practice, the resolution and, importantly, the quality of the final map that is obtained of a biological object depends on many factors. During the first half of 2018 (01/01/2018-01/07/2018), there was only one structure released in the EM-database (http://emsearch.rutgers. edu) from single particle cryo-EM of less than 2 Å resolution. It was the structure of beta-galactosidase at 1.9 Å (Bartesaghi et al., 2018). 423 structures had a resolution between 2-5 Å, and the number of structures greater than 5 Å was 221. The structure with the currently best resolution deposited in the EM-database is reported to have 1.6 Å resolution (Danev R, Yanagisawa H, Kikkawa M Cryo-EM structure of mouse heavy-chain apoferritin at 1.62 Å). Usually, biological objects reach a high resolution when they are very symmetric and exhibit a low degree of flexibility.
Finally, it is important to note that the estimation of the resolution of a cryo-EM structure is based on conventions which not the entire community agrees upon (van Heel and Schatz, 2005, 2017) and which are susceptible to distortion by improper refinement (e.g. ‘overrefinement’ or model bias). One number is not enough to entirely and reliably assess the quality of a cryo-EM reconstruction. Also the local resolution is important, especially local resolution of factors or any regions that are important for answering the biological question asked when imaging the given molecule.
The technical advances of the recent years resulting in an improved quality of cryo-EM maps makes it possible to model structures at near atomic resolution. De novo atomic modeling, so far only possible in X-ray crystallography, can now be done using cryo-EM. That means that at its current state, cryo-EM can be used to actually solve a structure.
